


360 Lake Landing Drive
Salisbury, NC 28146
- 2 beds
- 2 baths
- ~1/2 acre lot
- 1985 build
- – on site
More homes
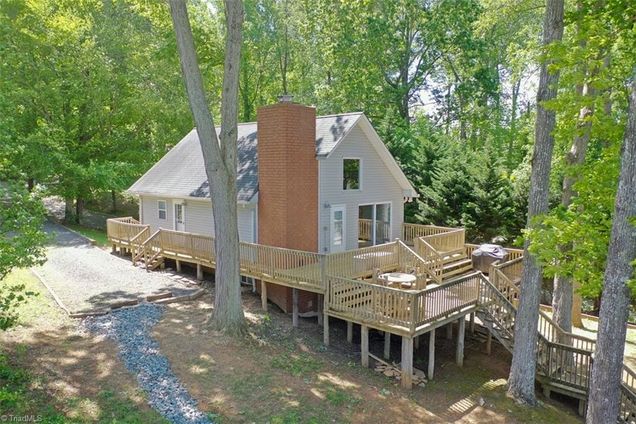
Priced to sell. Move in ready!! Do not miss out on this great property! Well maintained waterfront home with many upgrades on High Rock Lake. This property is on the the main channel, big open water (no bridges) close to marina and restaurants by boat. Deep water 8 Feet at end of pier, updated seawall. Here is the home you have been waiting for. Plenty of outdoor entertainment area, covered gazebo on private pier. Two bedrooms on main level, loft upstairs and full finished basement with a full bathroom. Two fireplaces and much more! Perfect for full-time living or a vacation home. So much potential. Multiple bedroom options. Come and make memories on the lake! HOA is for the use of the ramp beside the house and is voluntary.
![]()
Last checked:
As a licensed real estate brokerage, Estately has access to the same database professional Realtors use: the Multiple Listing Service (or MLS). That means we can display all the properties listed by other member brokerages of the local Association of Realtors—unless the seller has requested that the listing not be published or marketed online.
The MLS is widely considered to be the most authoritative, up-to-date, accurate, and complete source of real estate for-sale in the USA.
Estately updates this data as quickly as possible and shares as much information with our users as allowed by local rules. Estately can also email you updates when new homes come on the market that match your search, change price, or go under contract.
![]() Checking…
•
Last updated Apr 11, 2024
•
Checking…
•
Last updated Apr 11, 2024
•
MLS# 1104864 —

Walk Score®
Provided by WalkScore® Inc.
Walk Score is the most well-known measure of walkability for any address. It is based on the distance to a variety of nearby services and pedestrian friendliness. Walk Scores range from 0 (Car-Dependent) to 100 (Walker’s Paradise).
Air Pollution Index
Provided by ClearlyEnergy
The air pollution index is calculated by county or urban area using the past three years data. The index ranks the county or urban area on a scale of 0 (best) - 100 (worst) across the United Sates.
Sale history
| Date | Event | Source | Price | % Change |
|---|---|---|---|---|
|
10/13/23
Oct 13, 2023
|
CMLS | $481,500 | -3.7% | |
|
9/2/23
Sep 2, 2023
|
CMLS | $499,900 | -4.8% | |
|
6/30/23
Jun 30, 2023
|
CMLS | $524,900 | -12.5% |