


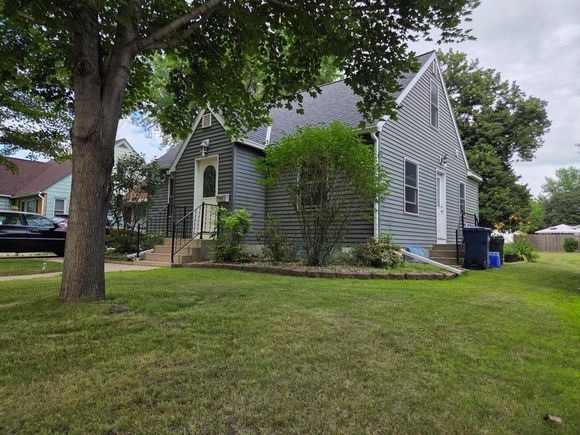
707 11th Street S
Benson, MN 56215
Map
- 3 beds
- 2 baths
- 1,880 sqft
- 7,971 sqft lot
- $72 per sqft
- 1946 build
- – on site
Come home to this great move-in ready 3 bedroom - 2 bathroom property. Very well maintained and very clean. With a large back yard perfect for entertaining or relaxing. This one won't last long so schedule your showing today!
![]()
Last checked:
As a licensed real estate brokerage, Estately has access to the same database professional Realtors use: the Multiple Listing Service (or MLS). That means we can display all the properties listed by other member brokerages of the local Association of Realtors—unless the seller has requested that the listing not be published or marketed online.
The MLS is widely considered to be the most authoritative, up-to-date, accurate, and complete source of real estate for-sale in the USA.
Estately updates this data as quickly as possible and shares as much information with our users as allowed by local rules. Estately can also email you updates when new homes come on the market that match your search, change price, or go under contract.
![]() Checking…
•
Last updated Jul 21, 2025
•
Checking…
•
Last updated Jul 21, 2025
•
MLS# 6758308 —
The Building
-
Year Built:1946
-
New Construction:false
-
Age Of Property:79
-
Construction Materials:Vinyl Siding
-
Construction Materials Desc:Frame
-
Roof:Asphalt
-
Accessibility Features:None
-
Levels:One and One Half
-
Main Level Finished Area:800.0000
-
Basement:Block
-
Basement:true
-
Foundation Area:800
-
Manufactured Home:No
-
Building Area Total:1880
-
Above Grade Finished Area:1160
-
Below Grade Finished Area:720
Interior
-
Fireplace:false
-
Amenities:Patio
Room Dimensions
-
Living Area:1880
Location
-
Directions:From Hwy 29 in Benson, MN head East on Thornton Ave, then South on 11th St S. Property will be on the East side of the street.
-
Latitude:45.308407
-
Longitude:-95.598858
The Property
-
Parcel Number:231437000
-
Zoning Description:Residential-Single Family
-
Property Type:Residential
-
Property Subtype:Single Family Residence
-
Property Attached:false
-
Additional Parcels:false
-
Lot Size Area:0.18
-
Lot Size Dimensions:50 160 50 160
-
Lot Size SqFt:7971.48
-
Lot Size Units:Acres
-
Water Source:City Water/Connected
-
Land Lease:false
Listing Agent
- Contact info:
- Agent phone:
- (320) 493-4848
- Office phone:
- (320) 843-3003
Taxes
-
Tax Year:2025
-
Tax Annual Amount:978
-
Tax With Assessments:978.0000
Beds
-
Bedrooms Total:3
Baths
-
Total Baths:2
-
Bath Description:1/2 Basement,Main Floor Full Bath
-
Full Baths:1
-
Half Baths:1
Heating & Cooling
-
Heating:Forced Air
-
Cooling:Central Air
Utilities
-
Electric:Circuit Breakers, 100 Amp Service
-
Sewer:City Sewer/Connected
Appliances
-
Appliances:Dryer, Gas Water Heater, Range, Refrigerator, Washer
Schools
-
High School District:Benson
The Community
-
Subdivision Name:Stones 2nd Add
-
Association:false
-
Assessment Pending:No
Parking
-
Parking Features:Concrete
Monthly cost estimate
Asking price
$135,900
| Expense | Monthly cost |
|---|---|
|
Mortgage
This calculator is intended for planning and education purposes only. It relies on assumptions and information provided by you regarding your goals, expectations and financial situation, and should not be used as your sole source of information. The output of the tool is not a loan offer or solicitation, nor is it financial or legal advice. |
$727
|
| Taxes | $81 |
| Insurance | $37 |
| Utilities | $181 See report |
| Total | $1,026/mo.* |
| *This is an estimate |
Walk Score®
Provided by WalkScore® Inc.
Walk Score is the most well-known measure of walkability for any address. It is based on the distance to a variety of nearby services and pedestrian friendliness. Walk Scores range from 0 (Car-Dependent) to 100 (Walker’s Paradise).
Bike Score®
Provided by WalkScore® Inc.
Bike Score evaluates a location's bikeability. It is calculated by measuring bike infrastructure, hills, destinations and road connectivity, and the number of bike commuters. Bike Scores range from 0 (Somewhat Bikeable) to 100 (Biker’s Paradise).
Air Pollution Index
Provided by ClearlyEnergy
The air pollution index is calculated by county or urban area using the past three years data. The index ranks the county or urban area on a scale of 0 (best) - 100 (worst) across the United Sates.
Sale history
| Date | Event | Source | Price | % Change |
|---|---|---|---|---|
|
7/20/25
Jul 20, 2025
|
Listed / Active | NORTHSTAR | $135,900 | 43.1% (14.7% / YR) |
|
8/17/22
Aug 17, 2022
|
NORTHSTAR | $95,000 | -0.9% | |
|
6/30/22
Jun 30, 2022
|
NORTHSTAR | $95,900 |