
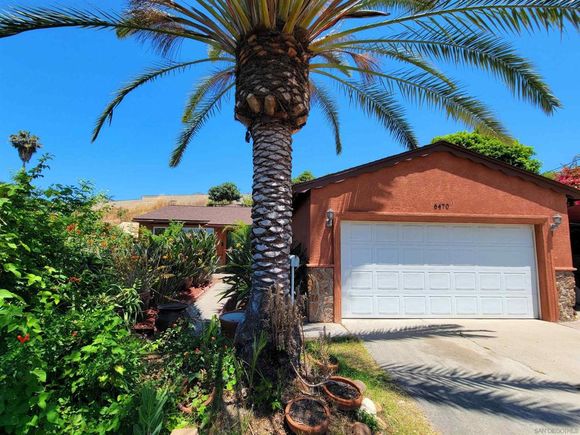


6470 Shirehall Dr
San Diego, CA 92111
- 3 beds
- 3 baths
- 1,874 sqft
- 8,700 sqft lot
- $517 per sqft
- 1963 build
- – on site
More homes
Incredible opportunity to make this Clairemont Mesa East home your own! Located on a quiet cul de sac street, the property features a newer roof (4 yrs), dual pane windows, updated bathrooms, skylights, newer water heater, home is wired for network and theatre and includes an electric vehicle charging station. The stepped backyard features a tiki hut with natural bamboo and palm facade, 18 different fruit trees/plants, solar powered greenhouse, and a hilltop deck with great views!
![]()
Last checked:
As a licensed real estate brokerage, Estately has access to the same database professional Realtors use: the Multiple Listing Service (or MLS). That means we can display all the properties listed by other member brokerages of the local Association of Realtors—unless the seller has requested that the listing not be published or marketed online.
The MLS is widely considered to be the most authoritative, up-to-date, accurate, and complete source of real estate for-sale in the USA.
Estately updates this data as quickly as possible and shares as much information with our users as allowed by local rules. Estately can also email you updates when new homes come on the market that match your search, change price, or go under contract.
![]() Checking…
•
Last updated Apr 2, 2025
•
Checking…
•
Last updated Apr 2, 2025
•
MLS# 230013484SD —
The Building
-
Year Built:1963
-
Construction Materials:Stucco
-
Roof:Shingle
-
Stories Total:1
-
Patio And Porch Features:Patio Open
-
Patio:1
Interior
-
Levels:One
-
Eating Area:Area
-
Room Type:Kitchen, Living Room, Master Bedroom, Master Bathroom, Walk-In Closet
-
Laundry:Electric Dryer Hookup, Gas Dryer Hookup, In Garage
-
Laundry:1
Room Dimensions
-
Living Area:1874.00
Location
-
Directions:DO NOT park on the street. Parking permit is enforced and you might get a ticket. Please park in the driveway. Cross Street: Brookshire St.
The Property
-
Property Type:Residential
-
Subtype:Single Family Residence
-
Zoning:R-1:SINGLE
-
Lot Size Area:8700.0000
-
Lot Size Acres:0.1997
-
Lot Size SqFt:8700.00
-
Lot Size Source:Assessor
-
View:1
-
View:Neighborhood
-
Land Lease:No
Listing Agent
- Contact info:
- No listing contact info available
Beds
-
Total Bedrooms:3
Baths
-
Total Baths:3
-
Full & Three Quarter Baths:3
-
Full Baths:3
The Listing
-
Parcel Number:4207301900
Heating & Cooling
-
Heating:1
-
Heating:Natural Gas, Forced Air
-
Cooling:Yes
-
Cooling:See Remarks
Utilities
-
Water Source:Public
Appliances
-
Appliances:Dishwasher, Microwave, Refrigerator, Gas Cooking
-
Included:Yes
The Community
-
Subdivision:Clairemont
-
Subdivision:Clairemont
-
Neighborhood:Mission Village West
-
Association:No
-
Pool:None
-
Senior Community:No
-
Private Pool:No
Parking
-
Parking:Yes
-
Parking:Driveway
-
Parking Spaces:5.00
-
Attached Garage:Yes
-
Garage Spaces:2.00
-
Uncovered Spaces:3.00
Walk Score®
Provided by WalkScore® Inc.
Walk Score is the most well-known measure of walkability for any address. It is based on the distance to a variety of nearby services and pedestrian friendliness. Walk Scores range from 0 (Car-Dependent) to 100 (Walker’s Paradise).
Bike Score®
Provided by WalkScore® Inc.
Bike Score evaluates a location's bikeability. It is calculated by measuring bike infrastructure, hills, destinations and road connectivity, and the number of bike commuters. Bike Scores range from 0 (Somewhat Bikeable) to 100 (Biker’s Paradise).
Transit Score®
Provided by WalkScore® Inc.
Transit Score measures a location's access to public transit. It is based on nearby transit routes frequency, type of route (bus, rail, etc.), and distance to the nearest stop on the route. Transit Scores range from 0 (Minimal Transit) to 100 (Rider’s Paradise).
Soundscore™
Provided by HowLoud
Soundscore is an overall score that accounts for traffic, airport activity, and local sources. A Soundscore rating is a number between 50 (very loud) and 100 (very quiet).
Air Pollution Index
Provided by ClearlyEnergy
The air pollution index is calculated by county or urban area using the past three years data. The index ranks the county or urban area on a scale of 0 (best) - 100 (worst) across the United Sates.
Sale history
| Date | Event | Source | Price | % Change |
|---|---|---|---|---|
|
2/26/24
Feb 26, 2024
|
BRIDGE | $1,275,000 | -1.8% | |
|
2/9/24
Feb 9, 2024
|
BRIDGE | $1,299,000 | ||
|
1/26/24
Jan 26, 2024
|
BRIDGE | $1,299,000 |