
4939 Pointe Tremble
Algonac, MI 48001
- 4 beds
- 2 baths
- 1,740 sqft
- ~1/2 acre lot
- $224 per sqft
- 1917 build
- – on site
More homes
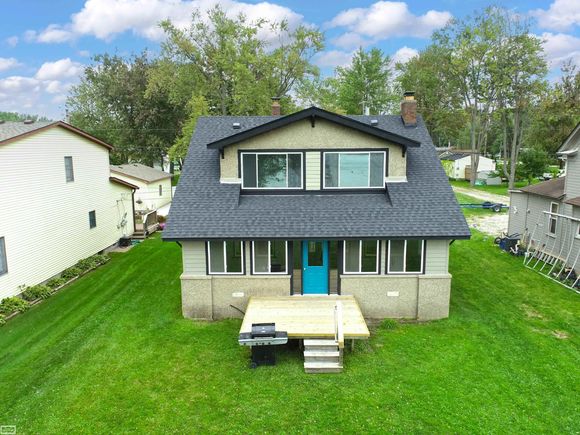
Welcome Home! Nestled in a picturesque setting on a HALF ACRE parcel on the beautiful St Clair River, this charming home is a canvas for your own style and creativity. Home offers 4 bedrooms, 2 full baths, a spacious studio/art/play room, new roof (2023), updated electrical and plumbing, hardwood floors throughout. Minutes away from the Clay Twp. park with amenities for the whole family. Grab this opportunity to create your dream home and enjoy waterfront living at its best!
![]()
Last checked:
As a licensed real estate brokerage, Estately has access to the same database professional Realtors use: the Multiple Listing Service (or MLS). That means we can display all the properties listed by other member brokerages of the local Association of Realtors—unless the seller has requested that the listing not be published or marketed online.
The MLS is widely considered to be the most authoritative, up-to-date, accurate, and complete source of real estate for-sale in the USA.
Estately updates this data as quickly as possible and shares as much information with our users as allowed by local rules. Estately can also email you updates when new homes come on the market that match your search, change price, or go under contract.
![]() Checking…
•
Last updated Apr 23, 2025
•
Checking…
•
Last updated Apr 23, 2025
•
MLS# 58050121222 —
The Building
-
Year Built:1917
-
Construction Materials:FiberCement
-
Architectural Style:Colonial
-
Levels:Two
-
Basement:false
-
Foundation Details:CrawlSpace
-
Patio And Porch Features:Deck, Porch
-
Building Area Source:PublicRecords
-
Above Grade Finished Area:1740.0
-
Above Grade Finished Area Source:PublicRecords
Interior
-
Flooring:Hardwood
-
Fireplace:true
-
Fireplace Features:WoodBurning
Room Dimensions
-
Living Area:1740.0
Location
-
Cross Street:Pointe Tremble / Island
The Property
-
Parcel Number:144330042000
-
Property Type:Residential
-
Property Subtype:SingleFamilyResidence
-
Lot Features:WaterView
-
Lot Size Acres:0.55
-
Lot Size Dimensions:50x534
-
Other Structures:Sheds
-
Waterfront Features:LakePrivileges, RiverFront, Seawall, Waterfront
-
Water Body Name:St. Clair River
Listing Agent
- Contact info:
- Agent phone:
- (586) 949-8300
- Office phone:
- (586) 949-8300
Taxes
-
Tax Legal Description:Lot 156 Sup Roy T Gilberts Plat No. 1 PCS 196, 732, 197 & 190 T2N R16E
-
Tax Annual Amount:2879.0
Beds
-
Total Bedrooms:4
Baths
-
Total Baths:2
-
Full Baths:2
Heating & Cooling
-
Heating:ForcedAir, NaturalGas
-
Heating:true
-
Cooling:false
Utilities
-
Sewer:PublicSewer
-
Water Source:Public
Appliances
-
Appliances:Dishwasher, Disposal, Oven, Range
Schools
-
High School District:Algonac
The Community
-
Subdivision Name:ROY T GILBERTS 1 - CLAY TOWNSHIP
-
Pool Features:None
-
Waterfront:true
-
Association:true
Parking
-
Garage:false
IDX provided courtesy of Realcomp II Ltd., via Estately and MiRealSource, © 2025 Realcomp II Ltd. Shareholders
![]()
Estately Inc. is a Michigan licensed brokerage #6505374810, managed by Michigan licensed REALTOR® broker Darren Yearsley #6505374810.
IDX information is provided exclusively for consumers personal, non-commercial use and may not be used for any purpose other than to identify prospective properties consumers may be interested in purchasing.
IDX provided courtesy of Realcomp II Ltd. via Estately Inc. and REALCOMP. ©2025 Realcomp II Ltd. Shareholders.
Walk Score®
Provided by WalkScore® Inc.
Walk Score is the most well-known measure of walkability for any address. It is based on the distance to a variety of nearby services and pedestrian friendliness. Walk Scores range from 0 (Car-Dependent) to 100 (Walker’s Paradise).
Bike Score®
Provided by WalkScore® Inc.
Bike Score evaluates a location's bikeability. It is calculated by measuring bike infrastructure, hills, destinations and road connectivity, and the number of bike commuters. Bike Scores range from 0 (Somewhat Bikeable) to 100 (Biker’s Paradise).
Soundscore™
Provided by HowLoud
Soundscore is an overall score that accounts for traffic, airport activity, and local sources. A Soundscore rating is a number between 50 (very loud) and 100 (very quiet).
Air Pollution Index
Provided by ClearlyEnergy
The air pollution index is calculated by county or urban area using the past three years data. The index ranks the county or urban area on a scale of 0 (best) - 100 (worst) across the United Sates.
Max Internet Speed
Provided by BroadbandNow®
This is the maximum advertised internet speed available for this home. Under 10 Mbps is in the slower range, and anything above 30 Mbps is considered fast. For heavier internet users, some plans allow for more than 100 Mbps.
Sale history
| Date | Event | Source | Price | % Change |
|---|---|---|---|---|
|
2/22/24
Feb 22, 2024
|
Sold | REALCOMP | $390,000 |