
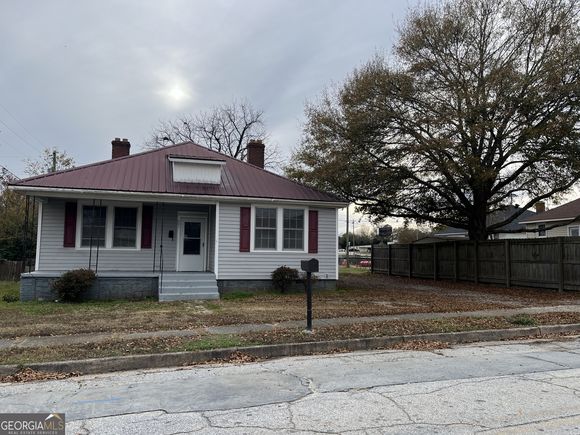
201 Snyder Avenue
Elberton, GA 30635
Map
- 2 beds
- 2 baths
- 1,091 sqft
- 7,405 sqft lot
- $108 per sqft
- 1926 build
- – on site
More homes
Come check out this updated home in the heart of Elberton. Home has fresh coat of paint, new water heater, new lights and ceiling fans and new flooring in the kitchen. Home also has central heat and air conditioning. Plus, a nice sized shop/barn in the backyard makes a perfect storage area or shop. If you are tired of renting and ready to become a homeowner call me today.
![]()
Last checked:
As a licensed real estate brokerage, Estately has access to the same database professional Realtors use: the Multiple Listing Service (or MLS). That means we can display all the properties listed by other member brokerages of the local Association of Realtors—unless the seller has requested that the listing not be published or marketed online.
The MLS is widely considered to be the most authoritative, up-to-date, accurate, and complete source of real estate for-sale in the USA.
Estately updates this data as quickly as possible and shares as much information with our users as allowed by local rules. Estately can also email you updates when new homes come on the market that match your search, change price, or go under contract.
![]() Checking…
•
Last updated Apr 11, 2024
•
Checking…
•
Last updated Apr 11, 2024
•
MLS# 10230279 —
The Building
-
Year Built:1926
-
Construction Materials:Vinyl Siding
-
Architectural Style:Traditional
-
Structure Type:House
-
Roof:Metal
-
Levels:One
-
Basement:Crawl Space
-
Total Finished Area:1091
-
Above Grade Finished:1091
-
Living Area Source:Public Records
Interior
-
Interior Features:Other
-
Flooring:Carpet, Laminate
-
Rooms:Other
Financial & Terms
-
Home Warranty:No
-
Possession:Close Of Escrow
Location
-
Latitude:34.103102
-
Longitude:-82.848912
The Property
-
Property Type:Residential
-
Property Subtype:Single Family Residence
-
Property Condition:Updated/Remodeled
-
Lot Features:City Lot, Level
-
Lot Size Acres:0.17
-
Lot Size Source:Public Records
-
Parcel Number:E34 032
-
Leased Land:No
-
Fencing:Back Yard, Fenced, Front Yard
Listing Agent
- Contact info:
- Agent phone:
- (706) 213-8779
- Office phone:
- (706) 213-8779
Taxes
-
Tax Year:2023
-
Tax Annual Amount:$482.20
Beds
-
Bedrooms:2
-
Bed Main:2
Baths
-
Full Baths:2
-
Main Level Full Baths:2
The Listing
-
Financing Type:VA
Heating & Cooling
-
Heating:Central
-
Cooling:Central Air
Utilities
-
Utilities:Cable Available, Electricity Available, High Speed Internet, Natural Gas Available, Phone Available, Sewer Connected, Water Available
-
Sewer:Public Sewer
-
Water Source:Public
Appliances
-
Appliances:Electric Water Heater, Oven/Range (Combo)
-
Laundry Features:In Kitchen
Schools
-
Elementary School:Elbert Co Primary/Elem
-
Middle School:Elbert County
-
High School:Elbert County
The Community
-
Subdivision:None
-
Community Features:Sidewalks, Street Lights, Walk To Shopping
-
Association:No
-
Association Fee Includes:None
Parking
-
Parking Features:Off Street
Extra Units
-
Other Structures:Barn(s)
Walk Score®
Provided by WalkScore® Inc.
Walk Score is the most well-known measure of walkability for any address. It is based on the distance to a variety of nearby services and pedestrian friendliness. Walk Scores range from 0 (Car-Dependent) to 100 (Walker’s Paradise).
Bike Score®
Provided by WalkScore® Inc.
Bike Score evaluates a location's bikeability. It is calculated by measuring bike infrastructure, hills, destinations and road connectivity, and the number of bike commuters. Bike Scores range from 0 (Somewhat Bikeable) to 100 (Biker’s Paradise).
Air Pollution Index
Provided by ClearlyEnergy
The air pollution index is calculated by county or urban area using the past three years data. The index ranks the county or urban area on a scale of 0 (best) - 100 (worst) across the United Sates.
Sale history
| Date | Event | Source | Price | % Change |
|---|---|---|---|---|
|
4/10/24
Apr 10, 2024
|
Sold | GAMLS | $118,000 | -8.5% |
|
4/7/24
Apr 7, 2024
|
Pending | GAMLS | $129,000 | |
|
12/14/23
Dec 14, 2023
|
Listed / Active | GAMLS | $129,000 |