


1521 Terilyn AVE
San Jose, CA 95122
Map
- 3 beds
- 1 bath
- 960 sqft
- 4,792 sqft lot
- $958 per sqft
- 1959 build
- – on site
More homes
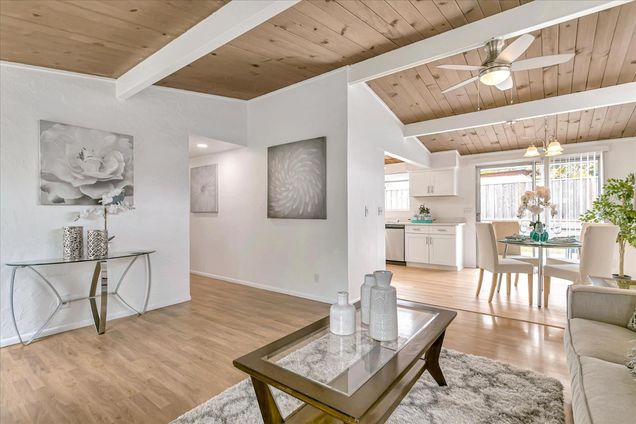
This home qualifies for America's Home Grant program. Buyers that are eligible can receive $10,000 for down payment and up to $7500 towards closing costs fees, reduced MI for less than 20% down, potential rate discount. This is the perfect place to call home! Nestled in a great neighborhood, this charming 3-bedroom, 1-bathroom home offers approximately 960 square feet of cozy living space. Step inside to discover a freshly painted interior and exterior, creating a bright and inviting atmosphere throughout. The kitchen is a chef's delight, with new wood laminate flooring, sleek quartz countertops, and modern cabinets, all complemented by stainless steel appliances that elevate the culinary experience. Outside, the spacious lot features a flourishing lemon tree and a convenient storage shed, providing ample space for outdoor activities and family gatherings. Located in a highly desirable area, this home offers convenience at your fingertips. With schools, a shopping center, and major freeways including 101, 280, and 680 just moments away, you'll enjoy easy access to everything you need. Don't let this opportunity slip away - seize the chance to make this charming home your own! Transparent pricing.
![]()
Last checked:
As a licensed real estate brokerage, Estately has access to the same database professional Realtors use: the Multiple Listing Service (or MLS). That means we can display all the properties listed by other member brokerages of the local Association of Realtors—unless the seller has requested that the listing not be published or marketed online.
The MLS is widely considered to be the most authoritative, up-to-date, accurate, and complete source of real estate for-sale in the USA.
Estately updates this data as quickly as possible and shares as much information with our users as allowed by local rules. Estately can also email you updates when new homes come on the market that match your search, change price, or go under contract.
![]() Checking…
•
Last updated Apr 10, 2025
•
Checking…
•
Last updated Apr 10, 2025
•
MLS# 81963056 —
The Building
-
Year Built:1959
-
Age:65
-
Type:Detached
-
Subclass:Single Family Home
-
Roofing:Composition
-
Foundation:Concrete Slab
-
# of Stories:1
-
Structure SqFt:960
-
Structure SqFt Source:Assessor
Interior
-
Kitchen:Cooktop - Gas, Countertop - Quartz, Dishwasher, Garbage Disposal, Hood Over Range, Oven Range - Gas, Skylight, Other
-
Dining Room:Eat in Kitchen
-
Family Room:No Family Room
-
Fireplace:No
-
Flooring:Laminate, Tile
Room Dimensions
-
Living SqFt:960
Location
-
Cross Street:Christopher
The Property
-
Lot Acres:0.1100
-
Lot Size Area Min:4792.00
-
Zoning:R1-8
-
Parcel Number:486-07-047
-
Horse Property:No
-
Fencing:Fenced Back
Listing Agent
- Contact info:
- No listing contact info available
Taxes
-
Property ID:81963056
Beds
-
Total:3
-
Beds Max:3
-
Beds Min:3
Baths
-
Full Baths:1
-
Bathroom Features:Granite, Stall Shower, Tile
The Listing
-
Additional Listing Info:Not Applicable
-
Automated Valuations Allowed:1
Heating & Cooling
-
Cooling Methods:Ceiling Fan, Whole House / Attic Fan
-
Heating Methods:Wall Furnace
Utilities
-
Utilities:Public Utilities
-
Sewer/Septic System:Sewer - Public
-
Water Source:Public
Appliances
-
Laundry:Inside
The Community
-
HOA:No
-
Pool:No
Parking
-
Description and Access:Attached Garage
-
Garage:1
-
Garage:1
-
Garage Spaces:1
Walk Score®
Provided by WalkScore® Inc.
Walk Score is the most well-known measure of walkability for any address. It is based on the distance to a variety of nearby services and pedestrian friendliness. Walk Scores range from 0 (Car-Dependent) to 100 (Walker’s Paradise).
Bike Score®
Provided by WalkScore® Inc.
Bike Score evaluates a location's bikeability. It is calculated by measuring bike infrastructure, hills, destinations and road connectivity, and the number of bike commuters. Bike Scores range from 0 (Somewhat Bikeable) to 100 (Biker’s Paradise).
Transit Score®
Provided by WalkScore® Inc.
Transit Score measures a location's access to public transit. It is based on nearby transit routes frequency, type of route (bus, rail, etc.), and distance to the nearest stop on the route. Transit Scores range from 0 (Minimal Transit) to 100 (Rider’s Paradise).
Soundscore™
Provided by HowLoud
Soundscore is an overall score that accounts for traffic, airport activity, and local sources. A Soundscore rating is a number between 50 (very loud) and 100 (very quiet).
Air Pollution Index
Provided by ClearlyEnergy
The air pollution index is calculated by county or urban area using the past three years data. The index ranks the county or urban area on a scale of 0 (best) - 100 (worst) across the United Sates.
Sale history
| Date | Event | Source | Price | % Change |
|---|---|---|---|---|
|
6/11/24
Jun 11, 2024
|
BRIDGE | $898,000 | ||
|
5/16/24
May 16, 2024
|
CRMLS_CA | $898,000 | ||
|
5/13/24
May 13, 2024
|
Price Changed | MLSLISTINGS | $898,000 | -5.4% |