


1250 Sand Drift
San Diego, CA 92154
- 3 beds
- 3 baths
- 1,653 sqft
- 4,172 sqft lot
- $468 per sqft
- 2003 build
- – on site
More homes
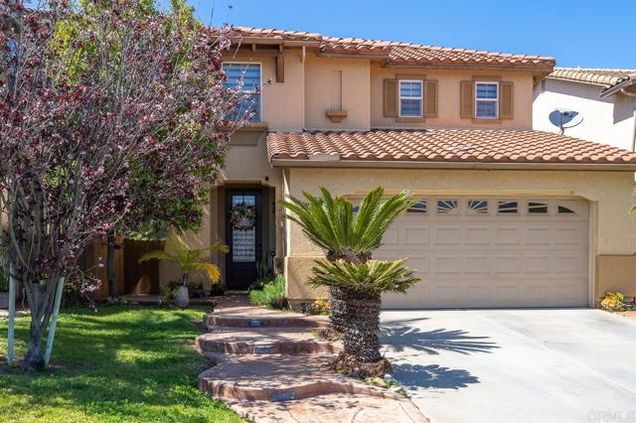
Wonderful home at the end of a cul-de-sac in highly sought after Ocean View Hills. Enjoy an open floorplan and a spacious backyard with no neighbors behind. Gorgeous travertine floors, granite countertops with full backsplash, backyard is ideal for entertaining with patio cover and bbq area, great curb appeal with stamped concrete steps leading to front door and beautiful landscaping, recessed lighting, custom shutters and blinds, extra storage closets, wood laminate floors upstairs, large primary bedroom with dual sinks and walk-in closet, and so much more. Conveniently located close to shopping and freeways. This is a must see.
![]()
Last checked:
As a licensed real estate brokerage, Estately has access to the same database professional Realtors use: the Multiple Listing Service (or MLS). That means we can display all the properties listed by other member brokerages of the local Association of Realtors—unless the seller has requested that the listing not be published or marketed online.
The MLS is widely considered to be the most authoritative, up-to-date, accurate, and complete source of real estate for-sale in the USA.
Estately updates this data as quickly as possible and shares as much information with our users as allowed by local rules. Estately can also email you updates when new homes come on the market that match your search, change price, or go under contract.
![]() Checking…
•
Last updated May 6, 2025
•
Checking…
•
Last updated May 6, 2025
•
MLS# CRPTP2301453 —
The Building
-
Year Built:2003
-
Building Area Units:Square Feet
-
Stories:2
-
Levels:Two Story
-
Entry Level:1
-
Building Area Total:1653
-
Building Area Source:Public Records
Interior
-
Interior Features:Family Room
-
Fireplace:false
-
Fireplace Features:None
Room Dimensions
-
Living Area:1653
-
Living Area Units:Square Feet
Location
-
Directions:GPS
The Property
-
Property Type:Residential
-
Property Subtype:Single Family Residence
-
Exterior Features:Backyard
-
Parcel Number:6452712400
-
Zoning:R-1:
-
Lot Features:Cul-De-Sac
-
Lot Size Area:0.0958
-
Lot Size Acres:0.0958
-
Lot Size SqFt:4172
-
Lot Size Units:Acres
-
View:None
-
View:false
Listing Agent
- Contact info:
- Agent phone:
- (619) 805-6496
Beds
-
Bedrooms Total:3
Baths
-
Total Baths:3
-
Full Baths:2
-
Partial Baths:1
The Listing
-
Listing Terms:Cash
Heating & Cooling
-
Heating:Natural Gas
-
Heating:true
-
Cooling:None
-
Cooling:false
Utilities
-
Water Source:Public
Appliances
-
Laundry Features:Laundry Room
Schools
-
High School District:San Ysidro
The Community
-
Association:true
-
Association Fee:41
-
Association Fee Frequency:Monthly
-
Pool Private:false
-
Pool Features:None
Parking
-
Garage:true
-
Attached Garage:true
-
Garage Spaces:2
-
Carport:false
-
Parking Total:2
-
Parking Features:Attached
-
Covered Spaces:2
Walk Score®
Provided by WalkScore® Inc.
Walk Score is the most well-known measure of walkability for any address. It is based on the distance to a variety of nearby services and pedestrian friendliness. Walk Scores range from 0 (Car-Dependent) to 100 (Walker’s Paradise).
Bike Score®
Provided by WalkScore® Inc.
Bike Score evaluates a location's bikeability. It is calculated by measuring bike infrastructure, hills, destinations and road connectivity, and the number of bike commuters. Bike Scores range from 0 (Somewhat Bikeable) to 100 (Biker’s Paradise).
Transit Score®
Provided by WalkScore® Inc.
Transit Score measures a location's access to public transit. It is based on nearby transit routes frequency, type of route (bus, rail, etc.), and distance to the nearest stop on the route. Transit Scores range from 0 (Minimal Transit) to 100 (Rider’s Paradise).
Soundscore™
Provided by HowLoud
Soundscore is an overall score that accounts for traffic, airport activity, and local sources. A Soundscore rating is a number between 50 (very loud) and 100 (very quiet).
Air Pollution Index
Provided by ClearlyEnergy
The air pollution index is calculated by county or urban area using the past three years data. The index ranks the county or urban area on a scale of 0 (best) - 100 (worst) across the United Sates.
Sale history
| Date | Event | Source | Price | % Change |
|---|---|---|---|---|
|
5/24/23
May 24, 2023
|
Sold | BRIDGE | $775,000 | -6.0% |
|
4/5/23
Apr 5, 2023
|
CRMLS_CA | $824,900 | ||
|
3/29/23
Mar 29, 2023
|
CRMLS_CA | $824,900 | 106.2% (11.2% / YR) |