


1200 E Franklin Street
Chapel Hill, NC 27514
Map
- 3 beds
- 3 baths
- 1,514 sqft
- 16,117 sqft lot
- $317 per sqft
- 1952 build
- – on site
More homes
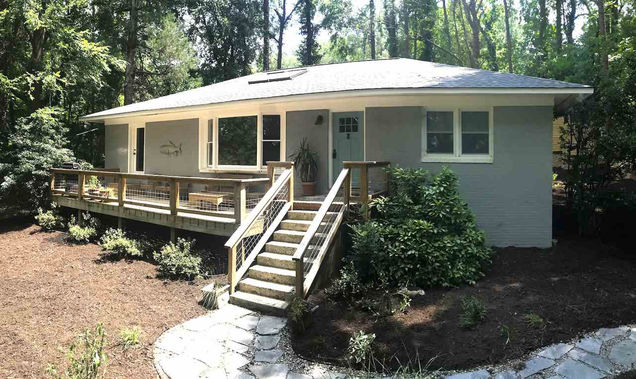
This bright and airy home sits right in town on Franklin Street - but you'd never know it. The ultra-private location seems worlds away from the hustle and bustle of town. You can easily walk or bike if you're so inclined and the entrance to the Bolin Creek Trail is just across Franklin St. A 2018 remodel completely upgraded the kitchen and baths. The hardwood floors were recently refinished and positively gleam! The clever layout makes the house live much larger than it's size. Move right in!
![]()
Last checked:
As a licensed real estate brokerage, Estately has access to the same database professional Realtors use: the Multiple Listing Service (or MLS). That means we can display all the properties listed by other member brokerages of the local Association of Realtors—unless the seller has requested that the listing not be published or marketed online.
The MLS is widely considered to be the most authoritative, up-to-date, accurate, and complete source of real estate for-sale in the USA.
Estately updates this data as quickly as possible and shares as much information with our users as allowed by local rules. Estately can also email you updates when new homes come on the market that match your search, change price, or go under contract.
![]() Checking…
•
Last updated Jun 19, 2025
•
Checking…
•
Last updated Jun 19, 2025
•
MLS# 2270066 —
The Building
-
Year Built:1952
-
New Construction:false
-
Construction Materials:Brick
-
Architectural Style:Bungalow
-
Structure Type:Site Built
-
Levels:One
-
Basement:false
-
Window Features:Insulated Windows
-
Patio And Porch Features:Deck
-
Accessibility Features:Level Flooring
-
Green Energy Efficient:Thermostat
-
Building Area Total:1514
-
Building Area Units:Square Feet
-
Above Grade Finished Area:1514
-
Above Grade Finished Area Units:Square Feet
-
Below Grade Finished Area Units:Square Feet
Interior
-
Rooms Total:10
-
Interior Features:Eat-in Kitchen
-
Flooring:Ceramic Tile
-
Fireplace:false
-
Laundry Features:Electric Dryer Hookup
Room Dimensions
-
Living Area:1514
-
Living Area Units:Square Feet
Location
-
Directions:North on E. Franklin St the home is on the right.
-
Latitude:35.923981
-
Longitude:-79.037561
-
Coordinates:-79.037561, 35.923981
The Property
-
Property Type:Residential
-
Lot Features:Hardwood Trees
-
Property Subtype:Single Family Residence
-
Lot Size Acres:0.37
-
Lot Size Area:16117.2
-
Lot Size Dimensions:25 x 96 x 133 x 211 x 105 x 174
-
Lot Size SqFt:16117.2
-
Lot Size Units:Square Feet
-
View:true
-
Green Water Conservation:Low-Flow Fixtures
Listing Agent
- Contact info:
- Agent phone:
- (910) 791-2829
- Office phone:
- (910) 791-2829
Taxes
-
Tax Annual Amount:4108
Beds
-
Bedrooms Total:3
Baths
-
Total Baths:3
-
Total Baths:3
-
Total Baths:3
-
Full Baths:3
Heating & Cooling
-
Heating:Forced Air
-
Heating:true
-
Cooling:Central Air
-
Cooling:true
Utilities
-
Utilities:Cable Available
-
Sewer:Public Sewer
-
Water Source:Public
Appliances
-
Appliances:Dishwasher
Schools
-
Elementary School:CH/Carrboro - Northside
-
Middle Or Junior School:CH/Carrboro - Guy Phillips
-
High School:CH/Carrboro - East Chapel Hill
The Community
-
Subdivision Name:Not in a Subdivision
-
Association:false
-
Pool Private:false
Parking
-
Garage:false
-
Attached Garage:false
-
Carport:false
-
Parking Features:Driveway
Walk Score®
Provided by WalkScore® Inc.
Walk Score is the most well-known measure of walkability for any address. It is based on the distance to a variety of nearby services and pedestrian friendliness. Walk Scores range from 0 (Car-Dependent) to 100 (Walker’s Paradise).
Soundscore™
Provided by HowLoud
Soundscore is an overall score that accounts for traffic, airport activity, and local sources. A Soundscore rating is a number between 50 (very loud) and 100 (very quiet).
Air Pollution Index
Provided by ClearlyEnergy
The air pollution index is calculated by county or urban area using the past three years data. The index ranks the county or urban area on a scale of 0 (best) - 100 (worst) across the United Sates.
Sale history
| Date | Event | Source | Price | % Change |
|---|---|---|---|---|
|
10/15/19
Oct 15, 2019
|
Sold | DMLS | $480,000 |