
Boston Area Home Prices by Transit Stop
It's no secret Boston-area home prices are among the highest in the country, but Estately wanted to show how those prices vary depending on which transit stop a home is near. To do this, Estately analyzed the last six months of home sales for houses, townhouses, and condos within a half-mile radius of each transit stop on Boston's Green, Blue, Red, Silver, and Orange Lines. We then broke them down by price per square foot.
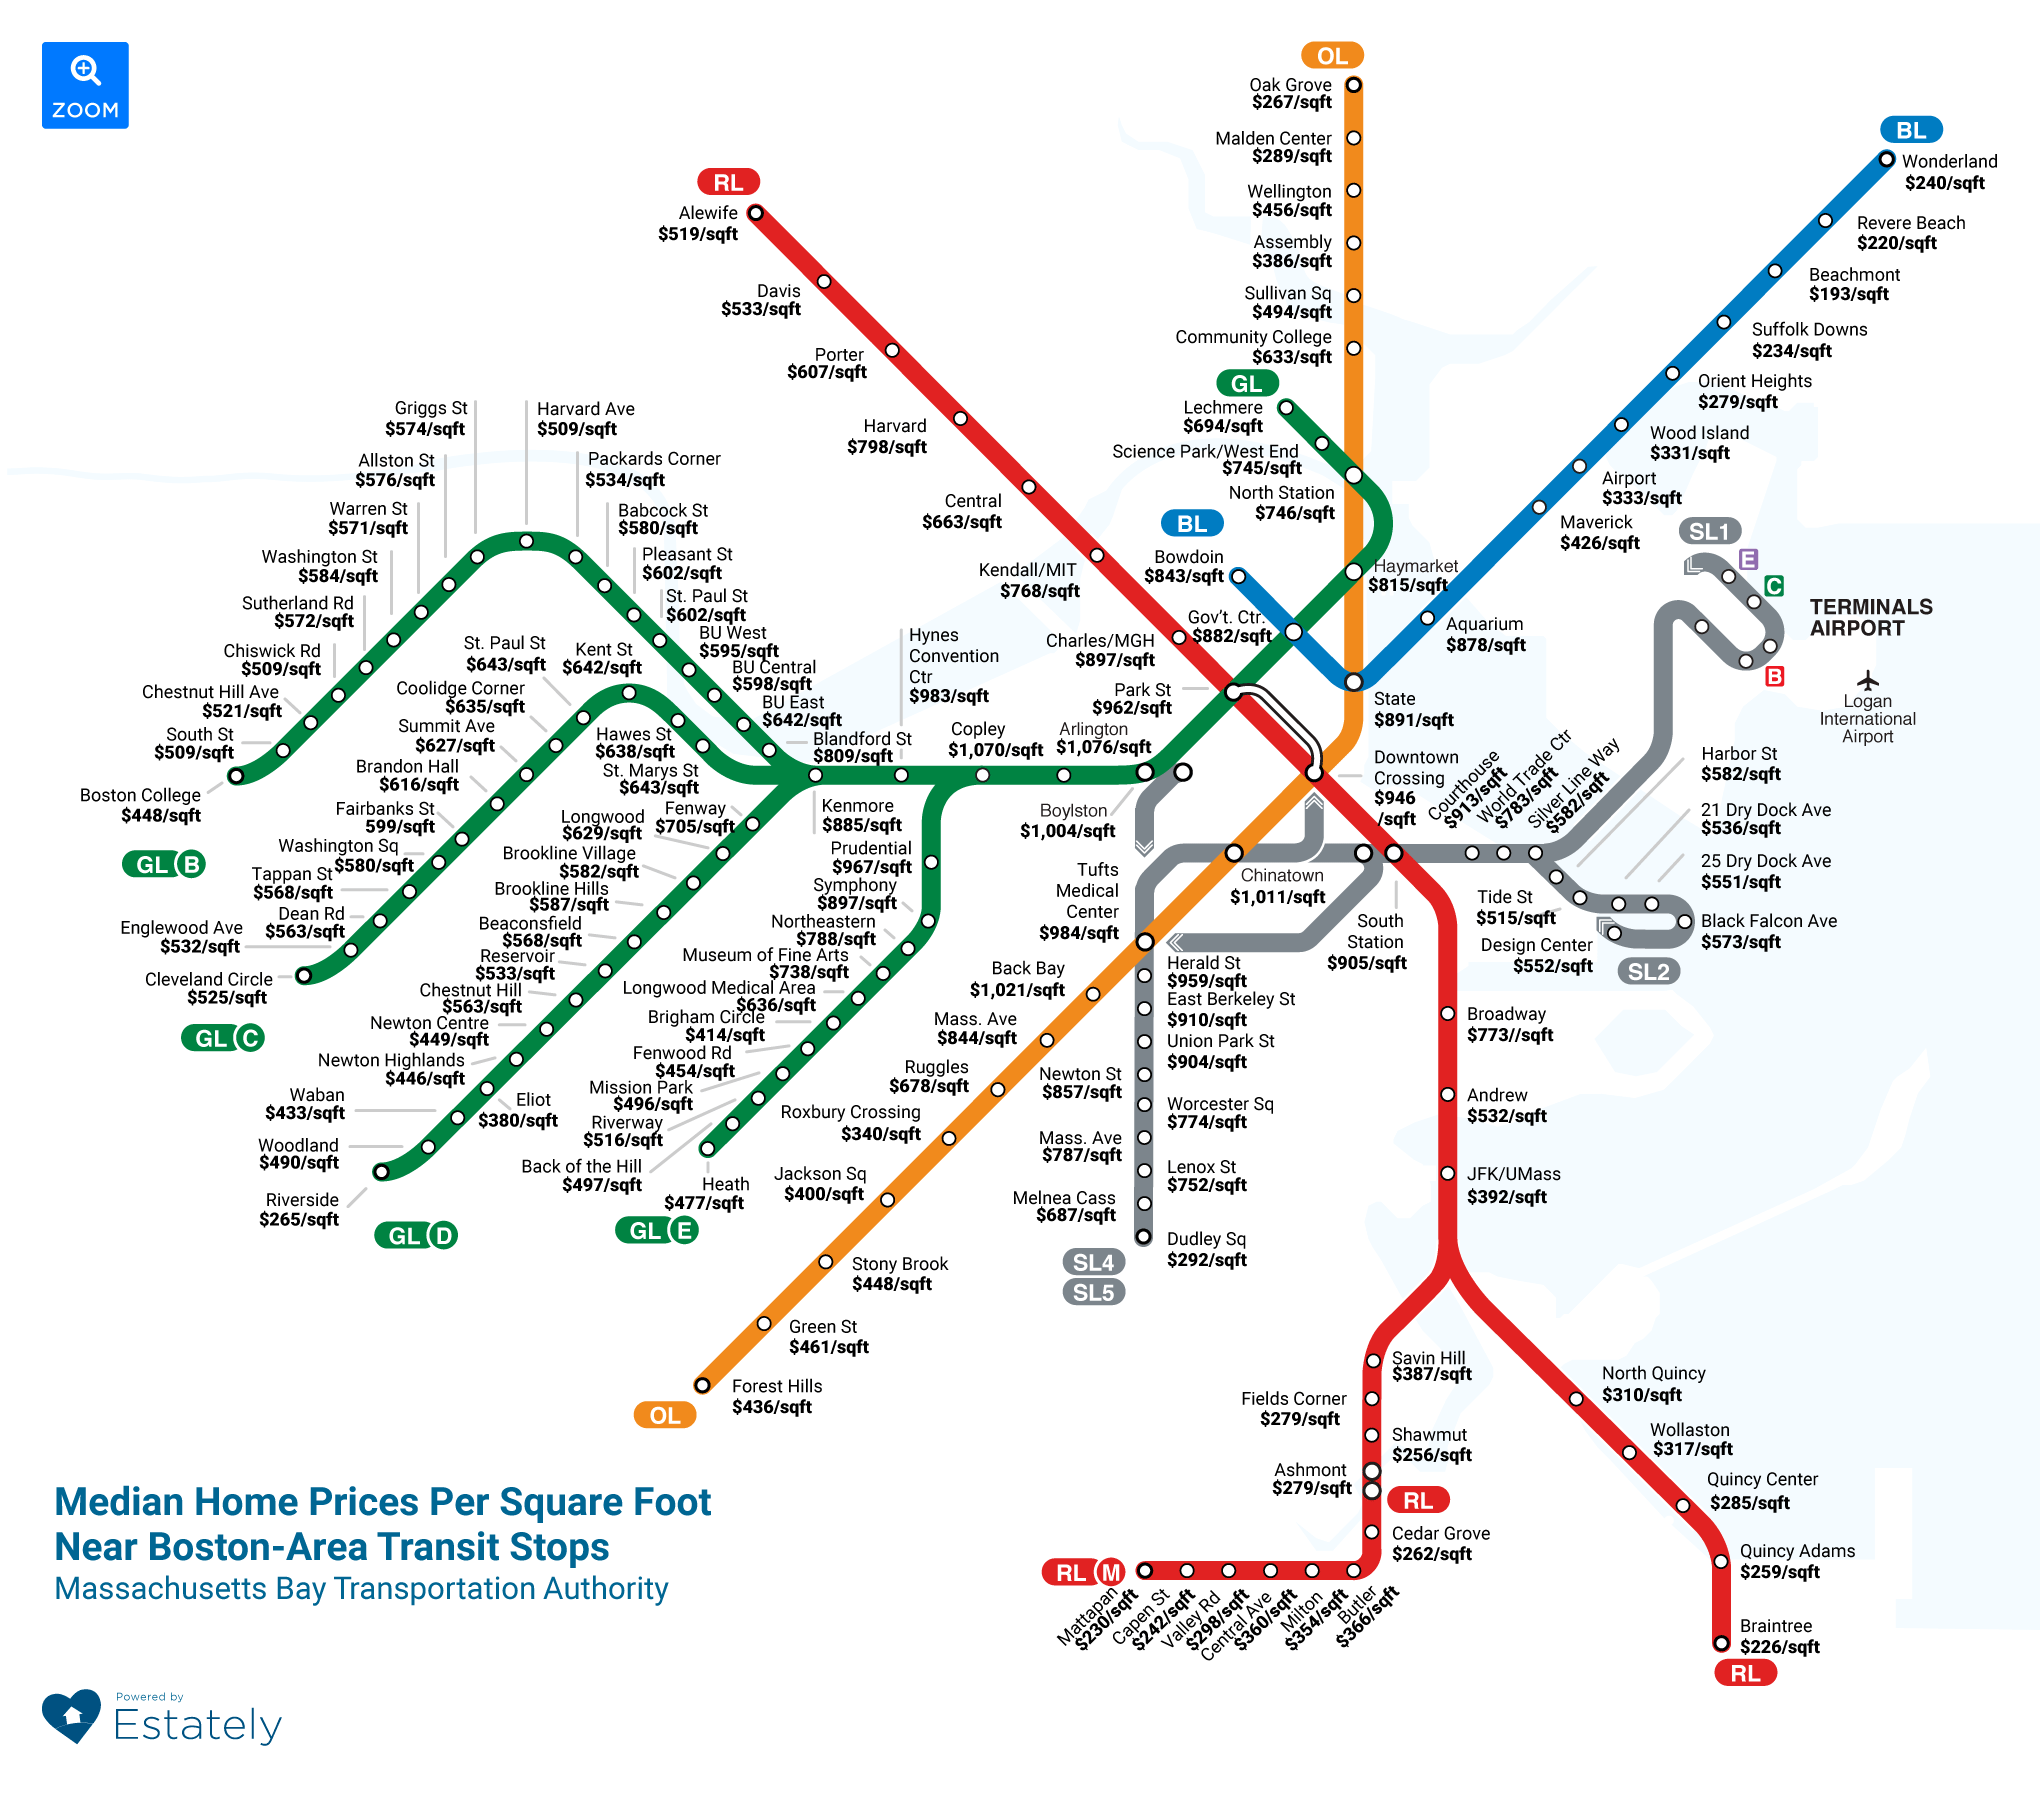
At an average of $1,076 per square foot, the Arlington Stop on the Green Line is the Boston Area's most expensive transit stop to buy a home near. The Beachmont stop on the Blue Line was the least expensive at $193 per square foot on average.
Overall, home prices along the Silver Line had the highest average price per square foot ($754), followed by Green Line "C" Branch—$708, Green Line "B" Branch—$673, Green Line "D" Branch—$672, Orange Line—$627, Red Line—$483, and Blue Line—$479.
Top ten most expensive Boston stops
| Stop name | Lines | Median sale price | Price per square foot | Homes for sale nearby |
|---|---|---|---|---|
| Arlington | $1,177,500 | $1,076 | Back Bay | |
| Copley | $1,082,500 | $1,070 | Back Bay | |
| Back Bay | $1,015,500 | $1,021 | South End | |
| Chinatown | $1,125,000 | $1,011 | Chinatown - Leather District | |
| Boylston | $1,040,000 | $1,004 | Beacon Hill | |
| Tufts Medical Center | $948,000 | $984 | Downtown Boston | |
| Hynes Convention Center | $744,250 | $983 | Back Bay | |
| Prudential | $915,000 | $967 | Back Bay | |
| Park Street | $941,000 | $962 | Beacon Hill | |
| Herald Street | $962,000 | $959 | South End |
Top ten least expensive Boston stops
| Stop name | Lines | Median sale price | Price per square foot | Homes for sale nearby |
|---|---|---|---|---|
| Beachmont | $290,000 | $193 | Beachmont | |
| Revere Beach | $260,000 | $220 | Crescent Beach | |
| Braintree | $435,000 | $226 | South Braintree | |
| Mattapan | $353,000 | $230 | Greater Mattapan | |
| Suffolk Downs | $208,000 | $234 | East Boston | |
| Wonderland | $257,000 | $240 | Crescent Beach | |
| Capen Street | $416,000 | $242 | Milton | |
| Shawmut | $338,000 | $256 | Dorchester | |
| Quincy Adams | $362,000 | $259 | South Quincy | |
| Cedar Grove | $457,000 | $262 | Dorchester |