U.S. Cities Ranked by Percentage of Income Spent on Owning a Home
Owning a home is a cornerstone of the American dream, but the percentage of income spent on a home varies widely across the country. Using data from the U.S. Census’ American Community Survey, Estately determined which U.S. cities were most costly for homeowners based on the percentage of income spent annually on selected homeownership costs (mortgage, taxes, insurance, utilities, fees, etc.).
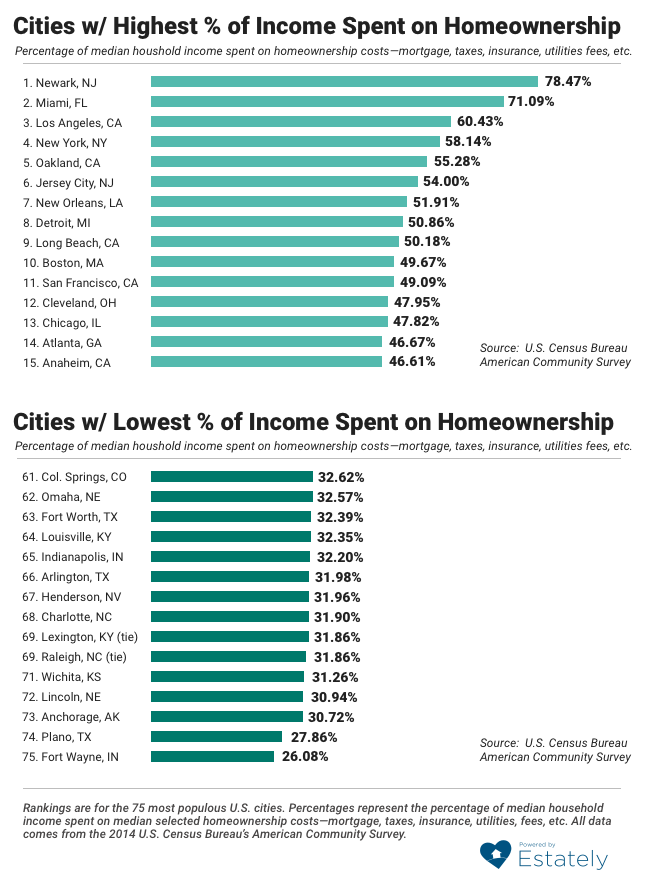
Geographically, out of the 75 most populous U.S. cities, the ones where people spent the highest percentage of their income on homeownership were in California and the New York Metropolitan Area, while the least costly were in the Midwest and Texas. Generally, lower-income cities tended to rank higher on the list, while higher-income cities ranked lower.
Here are the complete rankings:
- Newark, NJ — 78.47%
- Miami, FL — 71.09%
- Los Angeles, CA — 60.43%
- New York, NY — 58.14%
- Oakland, CA — 55.28%
- Jersey City, NJ — 54.00%
- New Orleans, LA — 51.91%
- Detroit, MI — 50.86%
- Long Beach, CA — 50.18%
- Boston, MA — 49.67%
- San Francisco, CA — 49.09%
- Cleveland, OH — 47.95%
- Chicago, IL — 47.82%
- Atlanta, GA — 46.67%
- Anaheim, CA — 46.61%
- Cincinnati, OH — 46.44%
- Milwaukee, WI — 45.58%
- Santa Ana, CA — 44.08%
- Fresno, CA — 43.57%
- San Diego, CA — 43.25%
- Stockton, CA — 42.13%
- Tampa, FL — 41.51%
- Dallas, TX — 41.35%
- St. Louis, MO — 41.24%
- Seattle, WA — 41.10%
- Sacramento, CA — 40.89%
- Baltimore, MD — 40.72%
- Washington, DC — 40.25%
- San Jose, CA — 40.17%
- Philadelphia, PA — 39.98%
- Portland, OR — 39.88%
- Honolulu, HI — 39.50%
- Riverside, CA — 39.43%
- Memphis, TN — 39.17%
- Tucson, AZ — 38.92%
- Houston, TX — 38.89%
- Minneapolis, MN — 38.62%
- Austin, TX — 37.99%
- St. Paul, MN — 37.85%
- Toledo, OH — 37.52%
- Buffalo, NY — 36.91%
- Denver, CO — 36.88%
- Greensboro, NC — 35.84%
- Jacksonville, FL — 35.72%
- Las Vegas, NV — 35.71%
- Phoenix, AZ — 35.68%
- Kansas City, MO — 35.46%
- Columbus, OH — 35.14%
- Nashville, TN — 34.83%
- Bakersfield, CA — 34.47%
- Albuquerque, NM — 34.32%
- Tulsa, OK — 34.18%
- Mesa, AZ — 33.67%
- Corpus Christi, TX — 33.26%
- El Paso, TX — 33.09%
- Aurora, CO — 32.99%
- Oklahoma City, OK — 32.91%
- Pittsburgh, PA — 32.90%
- San Antonio, TX — 32.85%
- Virginia Beach, VA — 32.70%
- Colorado Springs, CO — 32.62%
- Omaha, NE — 32.57%
- Fort Worth, TX — 32.39%
- Louisville, KY — 32.35%
- Indianapolis, IN — 32.20%
- Arlington, TX — 31.98%
- Henderson, NV — 31.96%
- Charlotte, NC — 31.90%
- Lexington-Fayette, KY — 31.86% (tie)
- Raleigh, NC — 31.86% (tie)
- Wichita, KS — 31.26%
- Lincoln, NE — 30.94%
- Anchorage, AK — 30.72%
- Plano, TX — 27.86%
- Fort Wayne, IN — 26.08%